
Building America Portfolio Update
- In a world of uncertainty, few things are as clear as an approved Federal Authorization. Because of this, the companies in Builders can look forward to potentially five years of solid revenue visibility.
- Congress has already approved nearly $1 trillion in spending for roads, bridges, and other spending related to infrastructure.
- There are relatively few companies that can do this work, they are at the chokepoint in one of the largest government spending programs in decades.
- What has been approved so far is just a down payment on decades of neglect.
- We expect this funding trend to continue due to the clearly documented need and uncharacteristic political cooperation. Both parties can agree this needs to be done.
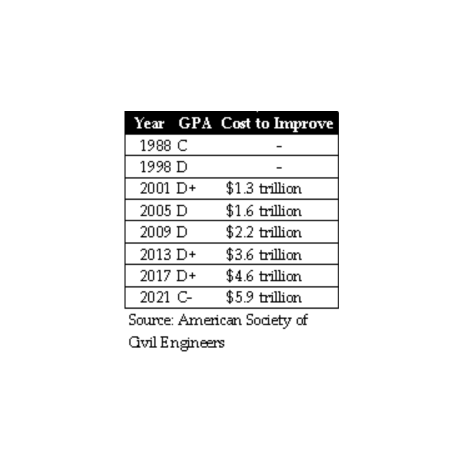
Progress has been made on the country’s infrastructural health with the number of structurally deficient bridges declining for 5 years in a row and the American Society of Civil Engineers (ASCE) raising its grade for US infrastructure to its highest rating in 33 years. However, much of this progress is due to the exceptionally low bar the nation’s infrastructure has set for decades. Between 1998 and 2017 US infrastructure never received a grade higher than a D+ by the ASCE while the cost to repair ballooned to $5.9 trillion over 10 years to get to a B grade compared to a $1.3 trillion estimated outlay in 2001.
The reality is that infrastructure in the United States is still a very long way from being able to meet the requirements of a growing economy. Motorists cross structurally deficient bridges 167.5 million times a day and at the current replacement rate it would take nearly 30 years to repair them all. Across the country, 36% of bridges need major repair work or replacement – spanning more than 6,100 miles if placed end to end. The American Road & Transportation Builders Association estimates it would cost nearly $260 billion to repair all of them.
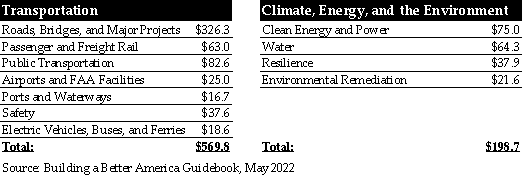 With the passage of H.R. 3684: Infrastructure Investment and Jobs Act (IIJA), signed into law on November 15, 2021, the US sees its largest federal investment in over a decade. The bill, according to government factsheets, allocates $973 billion in spending over the next 5 years – roughly $494 billion of this allotment is net new money related to infrastructure. With an expected reauthorization after 5 years, the bill is expected to put more than $1.2 trillion in infrastructure spending into the economy.
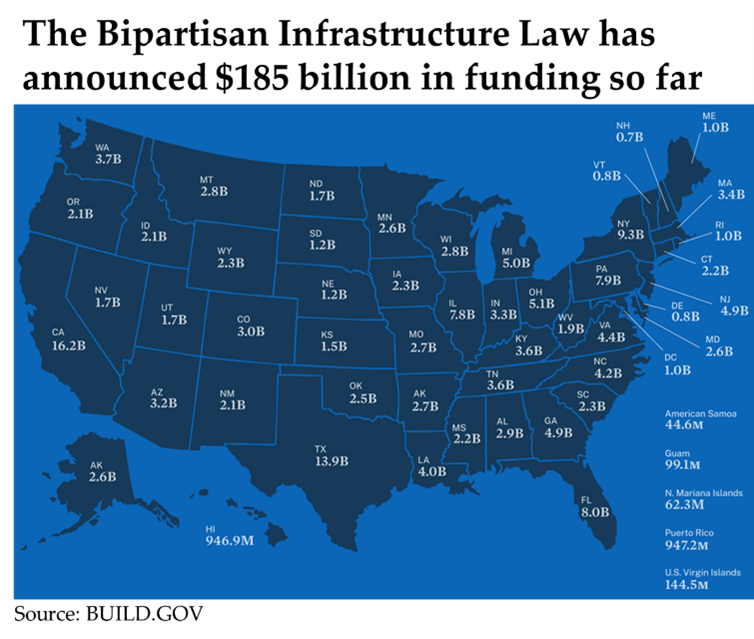 Take-up thus far has been swift – more than $185 billion in funding for 10,000 projects have been announced, with every state in the country receiving federal funds. Public investment had been trending about 20% below the 45-year average and while this doesn’t solve the entire problem, it is a huge sum of money and there are only so many companies that have the capabilities, qualifications, and expertise to handle the large-scale projects that the Infrastructure Investment and Jobs Act calls for. In 2019, both the EPA and Department of Transportation awarded more than a third of contractor dollars to fewer than 10 companies.
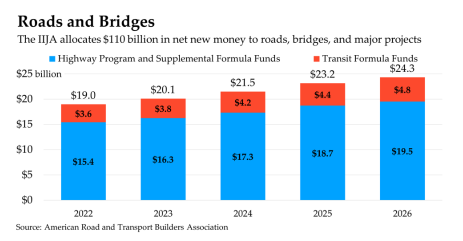
As we enter a year that will likely have a lot of uncertainty in the ultimate trajectory of economic activity or growth in corporate earnings, the Builders portfolio has a level of clarity that is absent in much of the broader market, in our view. As an example, the IIJA’s $110 billion authorization for roads, bridges, and other major projects is slated to grow at a 6% Compound Annual Growth Rate, year over year, for five years. Considering the average company in Builders generates just $7 billion in sales per year, this offers significant visibility over what could be a proportionally large jump in revenue.
 The portfolio also tilts to the Small-Mid Cap Value style box, which historically has handled rising interest rate environments and inflationary environments better, and generates 87% of its revenue in the United States or North America. For the companies that report US Government associated revenues, 46% of total sales is derived from government services. The portfolio also contains 4 of the 9 largest US Cement producers, which together are responsible for 29% of total cement production according to AlphaWise.
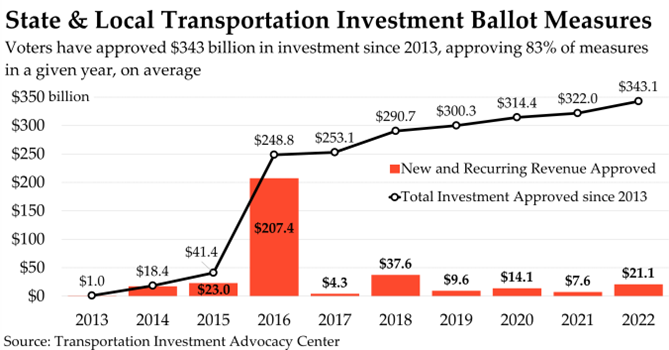 Furthermore, the general public has shown remarkable appetite for raising revenue related to infrastructure over the last decade. Since 2013 more than 2,800 measures have been approved by American voters with an overall approval rate of 84%. 2015 was the only year where less than 70% of measures were approved. This has resulted in the approval of $343 billion in new and recurring revenue for transportation investment from State and Local governments.
Ultimately, however, it is our view that the largest justification for the strategy is the immensity of the task at hand. While the bipartisan agreement announced is substantial in nominal terms, it’s just one step in the process and still well short of what the ASCE estimates is required for a healthy infrastructure grade that can handle a growing economy. Excluding Broadband infrastructure and the financing vehicles, the bill commits $494 billion in above-baseline spending to infrastructure over 5 years. Using the ASCE estimates there’s still another $2.02 trillion required over the next 10 years just to get to a B grade.
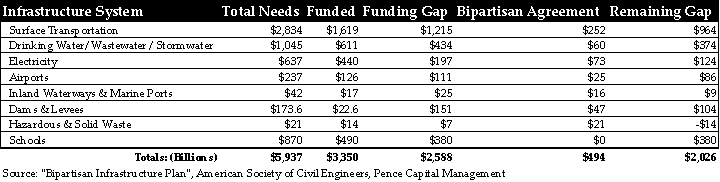
The Infrastructure Investment and Jobs Act is one of the most significant investments in the nation’s infrastructure in history. But decades of underinvestment mean we still need more.
January 12, 2023
Pence Capital Management